Historical Investment Returns Calculator
Introduction to Historical Investment Calculator
Data updated through year-end 2025 as noted below. The U.S. markets did well in 2025. The S&P 500 Index was up about 16%. Gold closed above $4,600 an ounce for the first time and had an ROI of about 75% for the year. Wheat, down in 2023 and flat in 2024 was down again in 2025 - about 9%. Interest rates, as represented by the U.S. 10-year Treasury were down about 40 basis points in 2025 (4.58% -> 4.18%).
You can use this Historical Investment Calculator to compare investment returns across multiple asset classes. The calculator includes historical price data for 14 widely followed indices, with some series extending back more than 100 years. The calculator compares nominal returns or inflation-adjusted returns. Inflation adjustments use U.S. Consumer Price Index data.
Why review historical investment returns?

Calculate and compare return-on-investment using 15 stock, bond, real estate & commodity indices.
- Invest single amount or series
- Adjust for inflation
- Compare: stocks, bonds, commodities, housing
- A great research and learning tool
The answer is not always obvious.
A category of traders known as chartists use historical price patterns to help predict future movements.
Although you could use this calculator to explore such ideas, there are specialized tools that are better suited for trading analysis.
Instead, this calculator is intended for long-term investors. It provides a high-level overview of how different asset classes have performed over time. I designed it especially for:
- Millennials and Gen Z, and
- bloggers, parents, and anyone who wants to teach or learn about the benefits of long-term investing.
According to an Ally Financial survey cited by Andrea Coombes in Forbes, 66% of people ages 18–29 (and 65% of those 30–39) say that investing in the stock market is scary or intimidating.
Many younger investors lack long-term experience. They were coming of age during the Great Recession and saw firsthand the impact on household finances. Some saw college funds decline. Others saw parents or neighbors lose their homes. Some experienced both.
Recessions can be stressful to live through.
However, this calculator shows that recessions are typically short interruptions in a long investing timeline. History suggests that the greater risk is not investing.
Long-term investing is usually uneventful. Before coding this calculator, I spent time considering its design and the lessons it might reveal.
I expected the analysis to show that one investment might outperform others when interest rates are rising.
I also expected that a different investment might be preferable when interest rates are falling.
While that may occur over shorter periods, the Historical Investment Calculator demonstrates that the consistent act of investing is critical for long-term financial security. In most cases, investing regularly—more than choosing any single asset—shapes financial outcomes. More below…
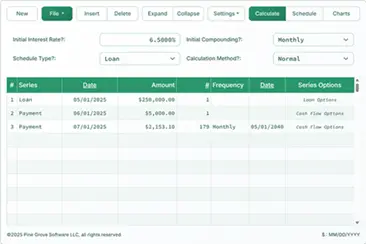
The Calculator-Calculate and compare historical returns for different assets
To set your preferred currency and date format, click the “$ : MM/DD/YYYY” link in the lower-right corner of any calculator.
Information
All indices have been updated through December 2025, with the exception of the Case-Shiller Index, which is current through October 2025.
Using the Historical Returns Calculator
This calculator lets you compare investment returns for similar or different asset classes.
Select any three indices from a total of 13, or select the 3-Month U.S. T-Bill as a proxy for cash. There are nine equity indices, two commodity indices (gold and wheat), one real estate index (Case-Shiller), and one fixed-income index (ICE Bank of America U.S. Corporate AAA Index).
Year-end closing values are included for all indices, going back as far as reliable data exists. Each index began at a different time; therefore, the earliest year available for analysis varies. For some indices, such as the DAX 30 or the Shanghai Composite, data is not available before 1991. At the other extreme, the Dow Jones Industrial Average data begins in 1915. The initial year for each index is listed below:
| Investment Choices | |
|---|---|
| Index | Earliest Data |
| Cash — US 3-Month T-Bill Proxy | 1933 |
| BOVESPA Index | 1994 |
| CAC 40 Index | 1991 |
| Case-Shiller Index | 1915 |
| DAX 30 Index | 1991 |
| Dow Jones Industrial Average | 1915 |
| FTSE 100 — Financial Times Stock Exchange 100 Index | 1969 |
| Gold — Fixing Price 10:30 A.M. (London time) | 1968 |
| Hang Seng Composite Index | 1987 |
| ICE BofAML U.S. Corporate AAA Index | 1988 |
| Nasdaq Index | 1972 |
| Nikkei 225 | 1950 |
| S&P 500 Index | 1928 |
| Shanghai Composite Index | 1991 |
| Wheat Prices | 1960 |
As noted above, you can compare returns for up to three assets at a time. The calculator imposes very few limits. However, it is not meaningful to start an analysis earlier than the first available data year for the index with the shortest history.
For example, the calculator can compare Dow returns with gold from 1915 through 2023. But that comparison gives the Dow an advantage, because the calculator does not have gold prices before year-end 1968 when calculating absolute returns.
Two investment modes
The calculator supports either a series of repeated investments (the default) or a single investment. When you select “No” for “One-time investment,” the calculator assumes a repeated investment made on the last day of each year.
For example, the “No” selection allows you to answer this question:
What would my annualized return on investment (ROI) and final value have been if I had invested $5,000 each year in gold between 2005 and 2025? (9.1%)
By contrast, the “Yes” selection allows you to answer this question:
What would my ROI and final value have been if I had made a one-time $10,000 investment in AAA corporate bonds in 1995 and then sold the investment in 2025? ($25,171, ROI 4.1%)
Adjust for inflation
Investors distinguish between nominal returns and real returns.
By default, the calculator shows nominal returns, meaning results are not adjusted for inflation. Nominal returns show gross profit. If you buy something for $1,000 and sell it three years later for $1,350, the nominal gain is $350.
However, nominal returns do not reflect real-world purchasing power. They ignore the impact of inflation. For evaluation, it is often better to review real (inflation-adjusted) results. The Historical Investment Returns Calculator includes an inflation-adjusted option.
The calculator adjusts for inflation using the U.S. Consumer Price Index (CPI) year-over-year change from December to December. If an index increases 5.5% while the CPI rises 2%, the calculator displays a real gain of 3.5%.
The final year in the selected range always serves as the base year. If you choose 2012–2022, the base year is 2022. In the base year, $1 equals $1, with no further adjustment.
This approach is practical. People generally understand the value of the dollar more clearly in recent years. Due to inflation, the dollar buys less in earlier years than in the base year.
Consider the following example.
Without adjusting for inflation, a one-time $10,000 investment in the S&P 500 at the end of 2012 would be worth nearly $27,000 by the end of 2022. The gain would be about $17,000, and the annualized return would be 10.4%.

Twenty-seven thousand dollars is the nominal value. But a dollar in 2022 does not buy what a dollar in 2012 bought.
After adjusting for inflation, the value drops from just under $27,000 to about $21,000.
What does this show?

It shows that the real gain would purchase about $13,500 of goods and services, not $17,700. The difference of approximately $4,200 represents the amount required to offset inflation. In other words, $14,200 ($10,000 + $4,200) in 2022 buys what $10,000 bought in 2012.
Stated another way, the real investment gain (real purchasing power) is about $13,500, not $17,700, which corresponds to a real rate of return of 8.9%.
The Historical Chart and the Logarithmic Scale
A chart drawn on a logarithmic scale provides a clearer visual comparison of relative performance. Two examples follow.
In Figure 3, note the green Nasdaq line. The increase from $10,000 to $100,000 represents a tenfold gain, yet the change appears small on the chart.
Further to the right, from about 2016 forward, the value rises from roughly $1,000,000 to about $1,500,000. That change is only 50%, but the chart shows it as a major move.

Non-logarithmic scale
Now review the same Nasdaq investment in Figure 4. This chart uses a logarithmic scale and gives a more accurate impression of performance.
The chart clearly shows the initial 10× gain to $100,000, while the later 1.5× increase beginning around 2016 is far less visually prominent.
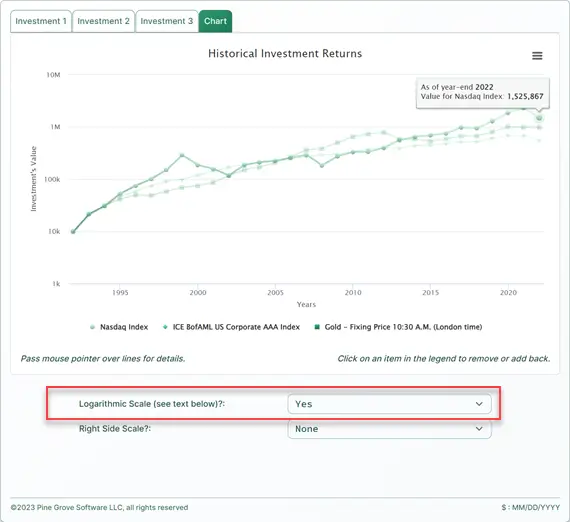
Logarithmic scale
For a deeper explanation of logarithmic scales, see Naomi Robbins’s column on Forbes.com, When Should I Use Logarithmic Scales in My Charts and Graphs?
Real Estate Is a Particular Case
Do you own a home?
Would you like to know whether your home’s value has kept pace with U.S. real estate values?
The Historical Investment Returns Calculator includes year-end values for the S&P CoreLogic Case-Shiller Home Price Index. You can compare your home’s change in value with this widely used benchmark.
To do this, enter your home’s purchase price as the amount invested and select the one-time investment option.
If your home’s current value matches the ending value shown, your home has tracked the Case-Shiller national average.
However, the annualized rate of return (ROR) shown will not reflect your actual ROR if you have a mortgage. Mortgage payments include interest, which this calculator does not consider.
If you want a more complete analysis of your real estate investment, including ROR with mortgage effects, see the Mortgage Calculator on this site.
Investment Returns FAQs (frequently asked questions)
- What is the annual return on investment (ROI) for the Dow Jones Industrial Average?
- Using year-end closing prices, from 1915 through 2023 the Dow Jones Industrials averaged a 6.4% annual return. Investing $1,000 each year would now be worth more than $13 million.
- What is the annual return on investment (ROI) for gold?
- Using year-end closing prices, from 1968 through 2023 gold averaged a 6.5% annual return. A one-time $1,000 investment would now be worth more than $49,000.
- What is the annual return on investment (ROI) for residential housing?
- Based on the Case-Shiller Home Price Index, from 1990 through 2023 housing produced a 4.4% rate of return. A $150,000 investment made in 1990 would be worth just over $613,000 at year-end 2023.
- What is the annual return on investment (ROI) for corporate AAA bonds?
- Using year-end closing prices from the ICE Bank of America U.S. Corporate AAA Index, AAA corporate bonds produced a 5.3% rate of return between 1990 and 2023, excluding coupon interest. A $10,000 investment made each year would now exceed $706,000.
- What is the annual return on investment (ROI) for wheat?
- Using year-end closing prices, the average annual rate of return (ROR) for wheat between 2000 and 2023 is 2.6%. A $5,000 investment made each year would now be worth $159,493.
#Moneymanagers and #investors teach the importance of long-term #Investing with the Historical Investment Returns Calculator. Overlay historical data going back, in some cases, over a century for major indices, futures, and real estate. https://t.co/VAHb4x9NGa pic.twitter.com/m1ybKprylC
— AccurateCalculators.com (@AccurateCalcs) February 3, 2024
David Quinn-Jacobs says:
Thanks very much for this. Does this calculator include dividends?
Karl says:
You’re welcome. No, it does not. Several people have asked about this, and I would like to add an option to include them. However, I have not been able to find a (free) source for the data I need. If you know of a source, please let me know.
Rodney says:
Very useful. Thank you.
Here is a variation that many, I believe, would find quite useful. Allow the user to copy their earnings from the my Social Security web site and paste them into your calculator. Then allow them to consider “what if” scenarios, i.e. investing a given percentage of income starting in a given security at a given point in their career. This would be great to emphasize the effects of saving early and aggressive vs. conservative strategies. It would also be a way for parents/grandparents to demonstrate the lesson to their children.
Karl says:
I’m happy to hear that you find the calculator useful.
And thank you for your suggestion. Perhaps some day I can add that feature. I have a lot on my plate right now.
Jennifer says:
Would it be possible to add an option to subtract the yearly brokerage/maintenance fee percentage? I did invest long term but the outcome is not even close to the graph because of the fees. It is important to make that insightful.
Karl says:
That’s a good idea, Jennifer. I’ll put it on the todo list and let you know when it’s implemented.
Karl says:
Jennifer, I’ve been meaning to point out that this investment calculator gives the user the ability to account for fees. This is not a historical calculator, but it still may be useful for your investment planning. Sorry I did not think of this when I first replied.
Lisa says:
Jennifer, I just wanted to second your statement. Many years later, I’m doing the math and realizing how much I’ve paid in fees for a manager to pick funds that underperformed the S&P 500. I can see what could have been and it’s sad. I wish I could go back and invest in an low-fee index fund. Great tool, Karl. Thank you.
Karl says:
Thank you, Lisa. There are lessons to be learned. That’s why I built this one for my (adult) kids.
Tony says:
Is there a way to add monthly investments?
Karl says:
This is strictly for historic investment comparison.
I suggest that you take a look at this investment calculator. This calculator gives the user the ability to project and calculate investment returns, adjust for inflation and deduct fees. (Plus a host of other things.)
Katherine Simson says:
What would it take to include a withdrawal option? For example, if you started with $1 million in 2001 but had to rely on withdrawals of $50,000 per year to make ends meet, what would you have after 10 years?
Karl says:
Please try this withdrawal calculator, and let me know if this meets your needs. If not, I have others, I can suggest.
Liz says:
Hi Karl,
I love the historical investment return calculator but I wish it would include money invested in a CD account. I’m trying to do a comparison between investing in the S&P 500 Index vs. investing in a CD account. Any chance including CD as an investment type in the near future?
Karl says:
Hi Liz, I think that’s a good idea. Including return on CDs will be a bit of a challenge, however. You’ll notice the calculator calculate returns using index data (changes in the value of an index). I did some research this morning, and for CDs, I only find historical data for rates, not a change in an index. I can certainly calculate returns using rates, but the challenge is if I added the code, which would only be used by CDs, it might make the calculator slower. But I will look into it.
Liz Marshall says:
Thank you for the quick reply Karl! Yes! If you can calculate the returns using just the historical data for rates, that would suffice. Let me know as soon as you have that available. Thank you so very much!
Q says:
Any way to include an option to calculate max 401k contribution returns? I’ve maxed my 401k and want to compare it against different indices to see if my investments are underperforming.
Karl says:
Use this internal rate of return calculator to plot the return on your 401K and compare it to whatever index you want to compare it to.
thomas butler says:
Fix comments so newest is first.
Can you add a print button! printing this without one creates a mess.
Thanks!
Karl says:
I guess it would be a mess. I need to revisit this calculator and finish it. I’ll add a print button to the to-do list.
About comment order, the newest group of comments are the first comments visitors see, but if I put the newest at the top, then the reply would come before the question or the original comment.
Karl says:
One thing. Did you see that you can export the chart to a PDF. You should then be able to print the PDF. To export, click on the 3 horizontal lines in the upper right corner of the chart.
thomas butler says:
Just used it; printed chart to a PDF! How great. For now, I used screen captures on the investment tables. Thanks!
I am buying some property and the owner is trying to show value. He says he normally makes 20% annually on his re-hab properties. I wanted to show he could have invested his money and gotten more than 20% annually. This calculator is just what I needed. Glad I didn’t buy bonds…thanks!
Another index that might be useful is the House Price Index..
or perhaps specific mutual funds
In my situation, I am comparing real estate investment to other avenues, Dow, NASDAQ, bonds, etc.
Karl says:
Wonderful. Glad the PDF works for you.
For the tables, you can try selecting the data and then copy and paste to a spreadsheet if you want to fiddle with the styling. You may have to use "Paste Special" and paste as plain text.
I’m not sure about any other housing index – but the S&P CoreLogic Case-Shiller U.S. National Home Price NSA Index is a housing index, and I’ve included the historical data in the calculator back to 2015.
I think including a mutual fund index would open a whole kettle of worms – the big problem there is what one would satisfy the majority of users.
thomas w butler says:
Of course! I didn’t see the Corelogic entry. Thanks. I your point with the mutual funds; which one to select…
MARK HUITSON says:
I wish I’d listened to my dad back in 1992. I was a kid who thought ‘not me’…….idiot I was then…..30 years later I’m here to prove it! Thanks Karl for creating and showing myself what could have been if I’d just stuck with investing……..
Karl says:
Thank you for reinforcing the lesson that this calculator hopes to teach.
Grandaddy says:
Most EXCELLENT calculator. BUT while i agree with being invested, scary things are out there! I am getting ready to retire going with the flow thinking on a 6% diversified investment return when boom i remember “lost decade”. For fun put in 100000 in S&P 500 INDEX for years2000 to 2010 and see what you get, like you said that may scare young folk that dont think diversified in all assets. Anyway great job.
Karl says:
Thank you! Yes, scary things are out there. That’s why time is your friend. Also, I think if you look, you’ll see other 10 year periods where equities underperform.
Gillian Robertson says:
I love the historic calculator and the graphics that go along with it. Trying to figure out which package I need to buy to get? Thankyou.
Karl says:
Glad you like the calculator, Gillian. Hope you find this to be good news, but there’s nothing to buy. The calculator is free as it is. Or were you looking for one to run on Windows or Mac? If that’s the case, there isn’t a version for those operating systems. Just this web version.
Gillian Robertson says:
Wonderful, is there a way to print a report?
Thanks
Karl says:
On the "Chart" tab, you can click on the menu (3 lines in the upper right corner) and download the chart to PDF and then print the PDF with your PDF viewer. The chart can be download to other graphic file formats as well.