Historical Investment Returns Calculator
Introduction to Historical Investment Calculator
Data updated through year-end 2025 as noted below. The U.S. markets did well in 2025. The S&P 500 Index was up about 16%. Gold closed above $4,600 an ounce for the first time and had an ROI of about 75% for the year. Wheat, down in 2023 and flat in 2024 was down again in 2025 - about 9%. Interest rates, as represented by the U.S. 10-year Treasury were down about 40 basis points in 2025 (4.58% -> 4.18%).
You can use this Historical Investment Calculator to compare investment returns across multiple asset classes. The calculator includes historical price data for 14 widely followed indices, with some series extending back more than 100 years. The calculator compares nominal returns or inflation-adjusted returns. Inflation adjustments use U.S. Consumer Price Index data.
Why review historical investment returns?

Calculate and compare return-on-investment using 15 stock, bond, real estate & commodity indices.
- Invest single amount or series
- Adjust for inflation
- Compare: stocks, bonds, commodities, housing
- A great research and learning tool
The answer is not always obvious.
A category of traders known as chartists use historical price patterns to help predict future movements.
Although you could use this calculator to explore such ideas, there are specialized tools that are better suited for trading analysis.
Instead, this calculator is intended for long-term investors. It provides a high-level overview of how different asset classes have performed over time. I designed it especially for:
- Millennials and Gen Z, and
- bloggers, parents, and anyone who wants to teach or learn about the benefits of long-term investing.
According to an Ally Financial survey cited by Andrea Coombes in Forbes, 66% of people ages 18–29 (and 65% of those 30–39) say that investing in the stock market is scary or intimidating.
Many younger investors lack long-term experience. They were coming of age during the Great Recession and saw firsthand the impact on household finances. Some saw college funds decline. Others saw parents or neighbors lose their homes. Some experienced both.
Recessions can be stressful to live through.
However, this calculator shows that recessions are typically short interruptions in a long investing timeline. History suggests that the greater risk is not investing.
Long-term investing is usually uneventful. Before coding this calculator, I spent time considering its design and the lessons it might reveal.
I expected the analysis to show that one investment might outperform others when interest rates are rising.
I also expected that a different investment might be preferable when interest rates are falling.
While that may occur over shorter periods, the Historical Investment Calculator demonstrates that the consistent act of investing is critical for long-term financial security. In most cases, investing regularly—more than choosing any single asset—shapes financial outcomes. More below…
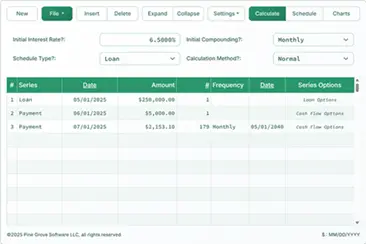
The Calculator-Calculate and compare historical returns for different assets
To set your preferred currency and date format, click the “$ : MM/DD/YYYY” link in the lower-right corner of any calculator.
Information
All indices have been updated through December 2025, with the exception of the Case-Shiller Index, which is current through October 2025.
Using the Historical Returns Calculator
This calculator lets you compare investment returns for similar or different asset classes.
Select any three indices from a total of 13, or select the 3-Month U.S. T-Bill as a proxy for cash. There are nine equity indices, two commodity indices (gold and wheat), one real estate index (Case-Shiller), and one fixed-income index (ICE Bank of America U.S. Corporate AAA Index).
Year-end closing values are included for all indices, going back as far as reliable data exists. Each index began at a different time; therefore, the earliest year available for analysis varies. For some indices, such as the DAX 30 or the Shanghai Composite, data is not available before 1991. At the other extreme, the Dow Jones Industrial Average data begins in 1915. The initial year for each index is listed below:
| Investment Choices | |
|---|---|
| Index | Earliest Data |
| Cash — US 3-Month T-Bill Proxy | 1933 |
| BOVESPA Index | 1994 |
| CAC 40 Index | 1991 |
| Case-Shiller Index | 1915 |
| DAX 30 Index | 1991 |
| Dow Jones Industrial Average | 1915 |
| FTSE 100 — Financial Times Stock Exchange 100 Index | 1969 |
| Gold — Fixing Price 10:30 A.M. (London time) | 1968 |
| Hang Seng Composite Index | 1987 |
| ICE BofAML U.S. Corporate AAA Index | 1988 |
| Nasdaq Index | 1972 |
| Nikkei 225 | 1950 |
| S&P 500 Index | 1928 |
| Shanghai Composite Index | 1991 |
| Wheat Prices | 1960 |
As noted above, you can compare returns for up to three assets at a time. The calculator imposes very few limits. However, it is not meaningful to start an analysis earlier than the first available data year for the index with the shortest history.
For example, the calculator can compare Dow returns with gold from 1915 through 2023. But that comparison gives the Dow an advantage, because the calculator does not have gold prices before year-end 1968 when calculating absolute returns.
Two investment modes
The calculator supports either a series of repeated investments (the default) or a single investment. When you select “No” for “One-time investment,” the calculator assumes a repeated investment made on the last day of each year.
For example, the “No” selection allows you to answer this question:
What would my annualized return on investment (ROI) and final value have been if I had invested $5,000 each year in gold between 2005 and 2025? (9.1%)
By contrast, the “Yes” selection allows you to answer this question:
What would my ROI and final value have been if I had made a one-time $10,000 investment in AAA corporate bonds in 1995 and then sold the investment in 2025? ($25,171, ROI 4.1%)
Adjust for inflation
Investors distinguish between nominal returns and real returns.
By default, the calculator shows nominal returns, meaning results are not adjusted for inflation. Nominal returns show gross profit. If you buy something for $1,000 and sell it three years later for $1,350, the nominal gain is $350.
However, nominal returns do not reflect real-world purchasing power. They ignore the impact of inflation. For evaluation, it is often better to review real (inflation-adjusted) results. The Historical Investment Returns Calculator includes an inflation-adjusted option.
The calculator adjusts for inflation using the U.S. Consumer Price Index (CPI) year-over-year change from December to December. If an index increases 5.5% while the CPI rises 2%, the calculator displays a real gain of 3.5%.
The final year in the selected range always serves as the base year. If you choose 2012–2022, the base year is 2022. In the base year, $1 equals $1, with no further adjustment.
This approach is practical. People generally understand the value of the dollar more clearly in recent years. Due to inflation, the dollar buys less in earlier years than in the base year.
Consider the following example.
Without adjusting for inflation, a one-time $10,000 investment in the S&P 500 at the end of 2012 would be worth nearly $27,000 by the end of 2022. The gain would be about $17,000, and the annualized return would be 10.4%.

Twenty-seven thousand dollars is the nominal value. But a dollar in 2022 does not buy what a dollar in 2012 bought.
After adjusting for inflation, the value drops from just under $27,000 to about $21,000.
What does this show?

It shows that the real gain would purchase about $13,500 of goods and services, not $17,700. The difference of approximately $4,200 represents the amount required to offset inflation. In other words, $14,200 ($10,000 + $4,200) in 2022 buys what $10,000 bought in 2012.
Stated another way, the real investment gain (real purchasing power) is about $13,500, not $17,700, which corresponds to a real rate of return of 8.9%.
The Historical Chart and the Logarithmic Scale
A chart drawn on a logarithmic scale provides a clearer visual comparison of relative performance. Two examples follow.
In Figure 3, note the green Nasdaq line. The increase from $10,000 to $100,000 represents a tenfold gain, yet the change appears small on the chart.
Further to the right, from about 2016 forward, the value rises from roughly $1,000,000 to about $1,500,000. That change is only 50%, but the chart shows it as a major move.

Non-logarithmic scale
Now review the same Nasdaq investment in Figure 4. This chart uses a logarithmic scale and gives a more accurate impression of performance.
The chart clearly shows the initial 10× gain to $100,000, while the later 1.5× increase beginning around 2016 is far less visually prominent.
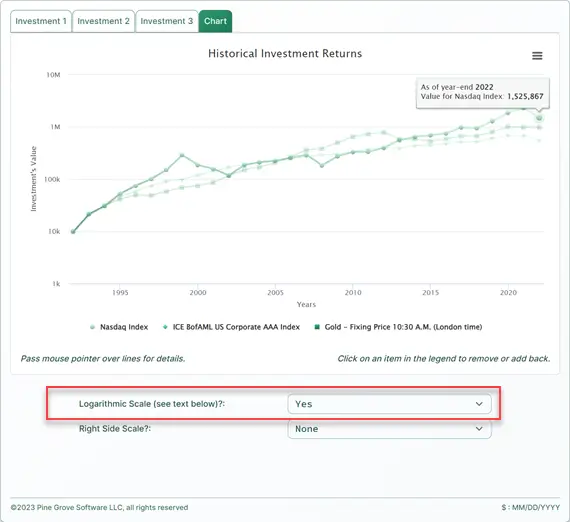
Logarithmic scale
For a deeper explanation of logarithmic scales, see Naomi Robbins’s column on Forbes.com, When Should I Use Logarithmic Scales in My Charts and Graphs?
Real Estate Is a Particular Case
Do you own a home?
Would you like to know whether your home’s value has kept pace with U.S. real estate values?
The Historical Investment Returns Calculator includes year-end values for the S&P CoreLogic Case-Shiller Home Price Index. You can compare your home’s change in value with this widely used benchmark.
To do this, enter your home’s purchase price as the amount invested and select the one-time investment option.
If your home’s current value matches the ending value shown, your home has tracked the Case-Shiller national average.
However, the annualized rate of return (ROR) shown will not reflect your actual ROR if you have a mortgage. Mortgage payments include interest, which this calculator does not consider.
If you want a more complete analysis of your real estate investment, including ROR with mortgage effects, see the Mortgage Calculator on this site.
Investment Returns FAQs (frequently asked questions)
- What is the annual return on investment (ROI) for the Dow Jones Industrial Average?
- Using year-end closing prices, from 1915 through 2023 the Dow Jones Industrials averaged a 6.4% annual return. Investing $1,000 each year would now be worth more than $13 million.
- What is the annual return on investment (ROI) for gold?
- Using year-end closing prices, from 1968 through 2023 gold averaged a 6.5% annual return. A one-time $1,000 investment would now be worth more than $49,000.
- What is the annual return on investment (ROI) for residential housing?
- Based on the Case-Shiller Home Price Index, from 1990 through 2023 housing produced a 4.4% rate of return. A $150,000 investment made in 1990 would be worth just over $613,000 at year-end 2023.
- What is the annual return on investment (ROI) for corporate AAA bonds?
- Using year-end closing prices from the ICE Bank of America U.S. Corporate AAA Index, AAA corporate bonds produced a 5.3% rate of return between 1990 and 2023, excluding coupon interest. A $10,000 investment made each year would now exceed $706,000.
- What is the annual return on investment (ROI) for wheat?
- Using year-end closing prices, the average annual rate of return (ROR) for wheat between 2000 and 2023 is 2.6%. A $5,000 investment made each year would now be worth $159,493.
#Moneymanagers and #investors teach the importance of long-term #Investing with the Historical Investment Returns Calculator. Overlay historical data going back, in some cases, over a century for major indices, futures, and real estate. https://t.co/VAHb4x9NGa pic.twitter.com/m1ybKprylC
— AccurateCalculators.com (@AccurateCalcs) February 3, 2024
Steve says:
Hi,
I want to use your calculator to support what’s due to an organization that did not receive $280k in 1922. I am making the argument that the organization is owed $87 million in todays dollars for that debt using your calculator.
Do you have an opinion as to any argument against using your calculator’s results?
What’s the deference in the gain and loss numbers?
Any suggestions for using a better method would be appreciated too.
Steve
Karl says:
Hello, I think your calculation is one way to look at the issue. You’re proposing that this is what the organization would have had if they had invested the money. However, more likely, the other side will say you should be using this inflation calculator. This calculator will tell you the equivalent amount today, adjusted for inflation.
Victor says:
Karl, thank you so much for this. This tool is really helpful for retirement planning as well as general edification.
Have you thought about adding any of the FTSE indices? For those of us here across the pond that would be very handy. Thanks again for your work and for sharing it.
Karl says:
Thank you.
I think that’s a good idea. I don’t know how I missed that one. FTSE is certainly a big name. Perhaps I didn’t find the data? I’ll check again. Give me a month or so, please.
Karl says:
Victor, I just finished updating the Historical Investment Calculator with end-of-year data for 2021. I’ve also added support for the FTSE 100 Index per your request. Thought you might like to know.
Victor says:
Thank you so much, Karl – for updating it and for replying to my post so it alerted me! I truly am grateful.
Karl says:
You’re welcome. My pleasure. I just hope the year-end closing prices are right. I was not able to find historical prices on the exchange’s site, so I’m relying on Wikipedia.
MANUEL E MOJICA says:
this is incredible, you will have a plug in for wp with this calculator
Karl says:
Thank you! However, at this time, I do not plan to make this calculator available as a plugin.
Max says:
Hi,
Do you have the option to include bonds (30 year, or 10 year) and or just cash savings?
Like I would like to see how my cash in a savings account (getting 0.5% APY) performed against stocks over the period including the inflation adjustment?
And do you have the ability to have up to date returns? Like for the S&P these guys https://dqydj.com/sp-500-return-calculator/ have the option for up to date like the month June 2022.
Great calculator and really helpful.
Thanks!
Karl says:
Hi, this is the proxy for corporate bonds ICE BofAML US Corporate AAA Index and this is the proxy for cash Cash – US 3-Month T-Bill Proxy. The returns are always annual. The intent of this calculator is to teach the importance of investing over a long period, not to compare investments over say an 18-month time horizon.
Anthony B Landrum says:
Thank you for creating and sharing this calculator. Tony
Karl says:
You’re welcome!
Vladimir Soukenik says:
Hello, absolutely great tool you have developed. Thank you very much. Can you please add Nasdaq 100 index? Or is it very similar to the Nasdaq index you already have? Thank you!
Karl says:
Hi, thank you for the compliment. And you ask a good question. I should be clearer with my documentation.
The calculator uses the Nasdaq Composite.
From the NASDAQ website:
The point of the calculator is to teach users the benefits of long-term investing. I’m not sure that adding another Nasdaq index would add much value, and due to the additional data being downloaded, it would slow the calculator down somewhat.
Vladimir says:
OK, so I get it. If I may than ask just about your personal opinion – would you invest in Nasdaq Composite or Nasdaq 100 if you had to choose between these two? Or is it just too similar to differentiate? Thank you!
Karl says:
I’m not qualified to give investment advice. Why not consider investing 50% in each index?
Sharon Cox Jennings says:
Does the S & P Index include dividends and capital gains in the return
Karl says:
The S&P index is a price-tracking index. It does not include dividends. I’m not sure what you mean by capital gains. If a stock that is included in the index goes from $50 to $60 (a capital gain) the price change of the stock is captured by the index.
Linny says:
Are these average return or real return? Real return may be more appropriate way of measuring return since average can be deceiving to measure something that can go below your basis.
For example, if you have $100 and it goes down 50% year 1, you have $50. If it goes up 50% year 2, you have $75, however average rate of return calculation would make you think you got your money back even though you are still down 25%.
Karl says:
Good question. The calculator is using real returns. You can confirm that by looking at the data i.e. the closing price and the percent change columns.
Matthias says:
This is an awesome calculator!
What would be nice is to be able to use a stock (I’m actually interested in ETF tracking an index, such as All Country World Index) and include the dividends paid out. This would allow one to also see the compounding effect if those dividends are re-invested directly.
Karl says:
The purpose of this calculator is to teach the importance and benefit of long-term investing and how investing in any asset class is better than not investing. It is not an investment tool to be used to help you make an investment decision today.
While what you suggest could be helpful, it would be costly and time-consuming to obtain the data.
jc says:
Thanks for the great calculator. However there are a few extras I think are missing and are important to consider. When you are looking at the investment return on the S&P500, its common that the actual investment one would make would be in a fund such as Vanguard’s VOO or VTSAX, which pay dividends often in the ballpark of ~1%. This greatly skews the real-world investment performance. Would it be possible to have that kind of feature added for investment vehicles for which it makes sense? Maybe just an extra check-box that the user can add an extra simulated dividend amount to the index value shown. It might also be helpful if the user could include their own fully-custom theoretical asset with a custom “average return” over the time period, to compare to these indexes.
Also, is it possible to do download this calculator for offline-usage? Or possibly its underlying data?
Karl says:
Thank you for taking the time to comment. Understanding how users use the calculators is important to me.
I’m aware that leaving out dividends understates performance. I had never included them, because I never had a good source for the data. Perhaps giving users the option to include an average is a reasonable approach. It certainly would allow users to see just how important dividends can be in the overall return, and that’s the point of this calculator – to teach that long term investing is what leads to success.
The problem I have now is I’m not able to allocate any time to this calculator this year to make a change. I have many other changes planned for already.
The calculator would not work offline – so it is not downloadable.
I’m not licensed to redistribute the data, and besides, it’s not in a format that would be useful. It’s embedded in the code.